/ Problem
Structuring the problem
An AI product strategist needs to understand models by building them, not just in theory. Training three ML models on workforce data, and making a strategic call when the outputs didn't match the brief.
The brief was to predict employee churn. Before building anything, I needed to decide how to structure the problem, which tools would answer which questions, and who in the organisation needed to understand the output.
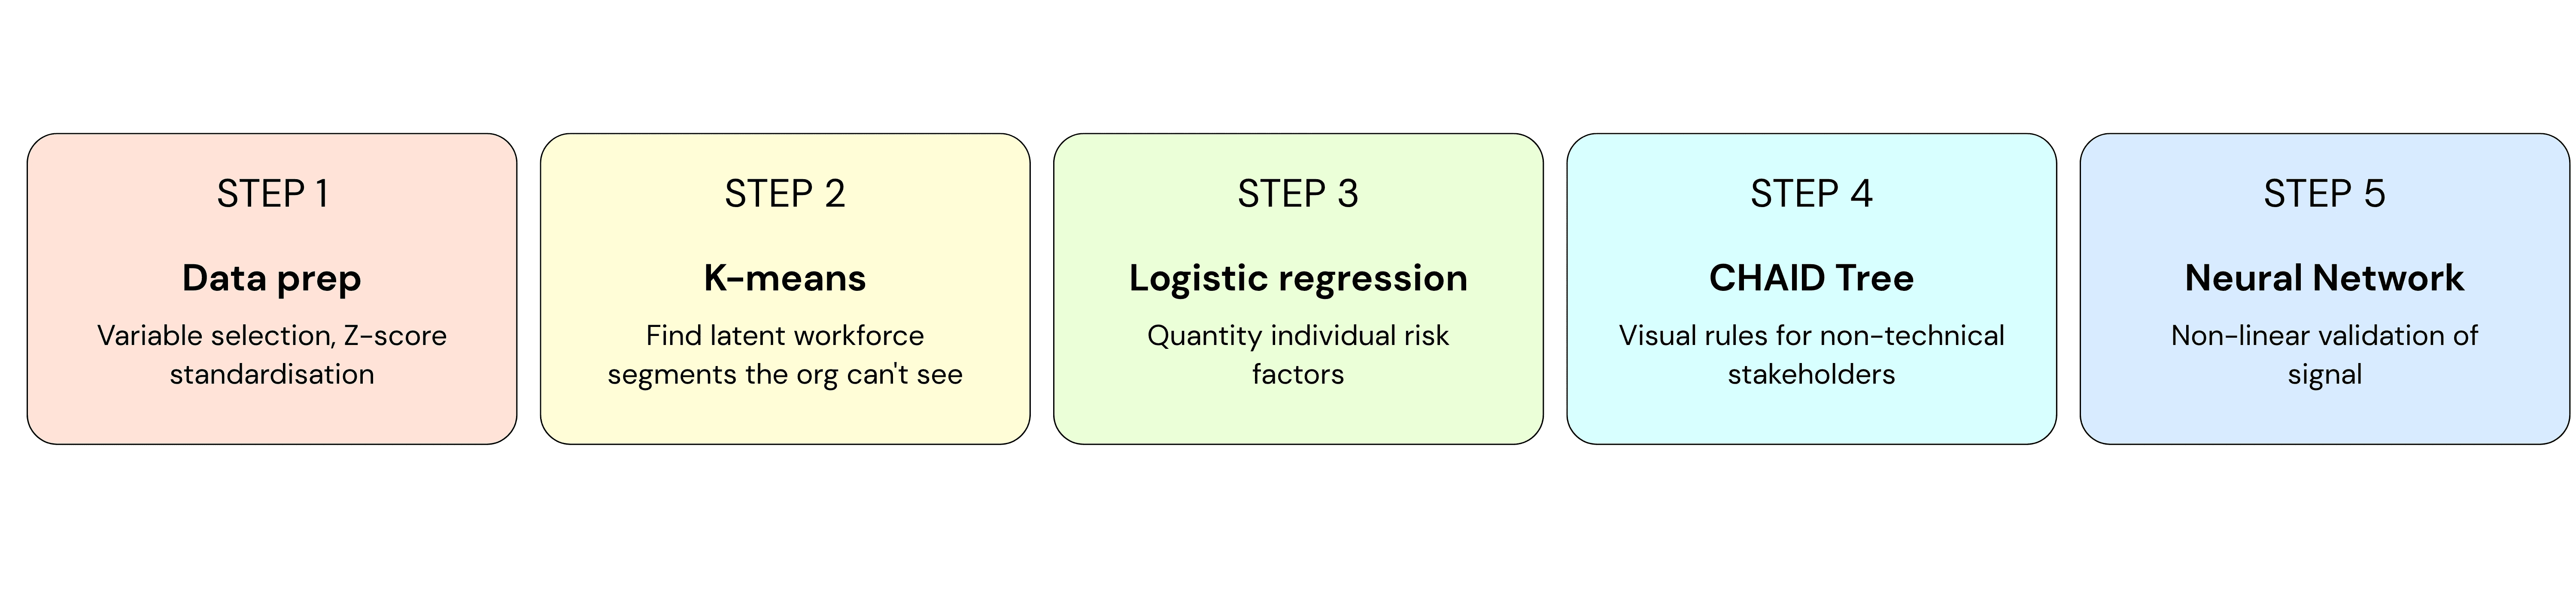
The sequence is to start with unsupervised clustering to surface segments the organisation couldn't see from its own dashboards, then layer on three predictive models, each chosen for a different audience. Logistic regression produces coefficients that justify policy to an HR team. CHAID produces a visual decision tree that carries a story in a boardroom. Finally, a neural network validates that findings hold when you relax the simpler models' assumptions.
/ The Patterns Hiding in Plain Sight
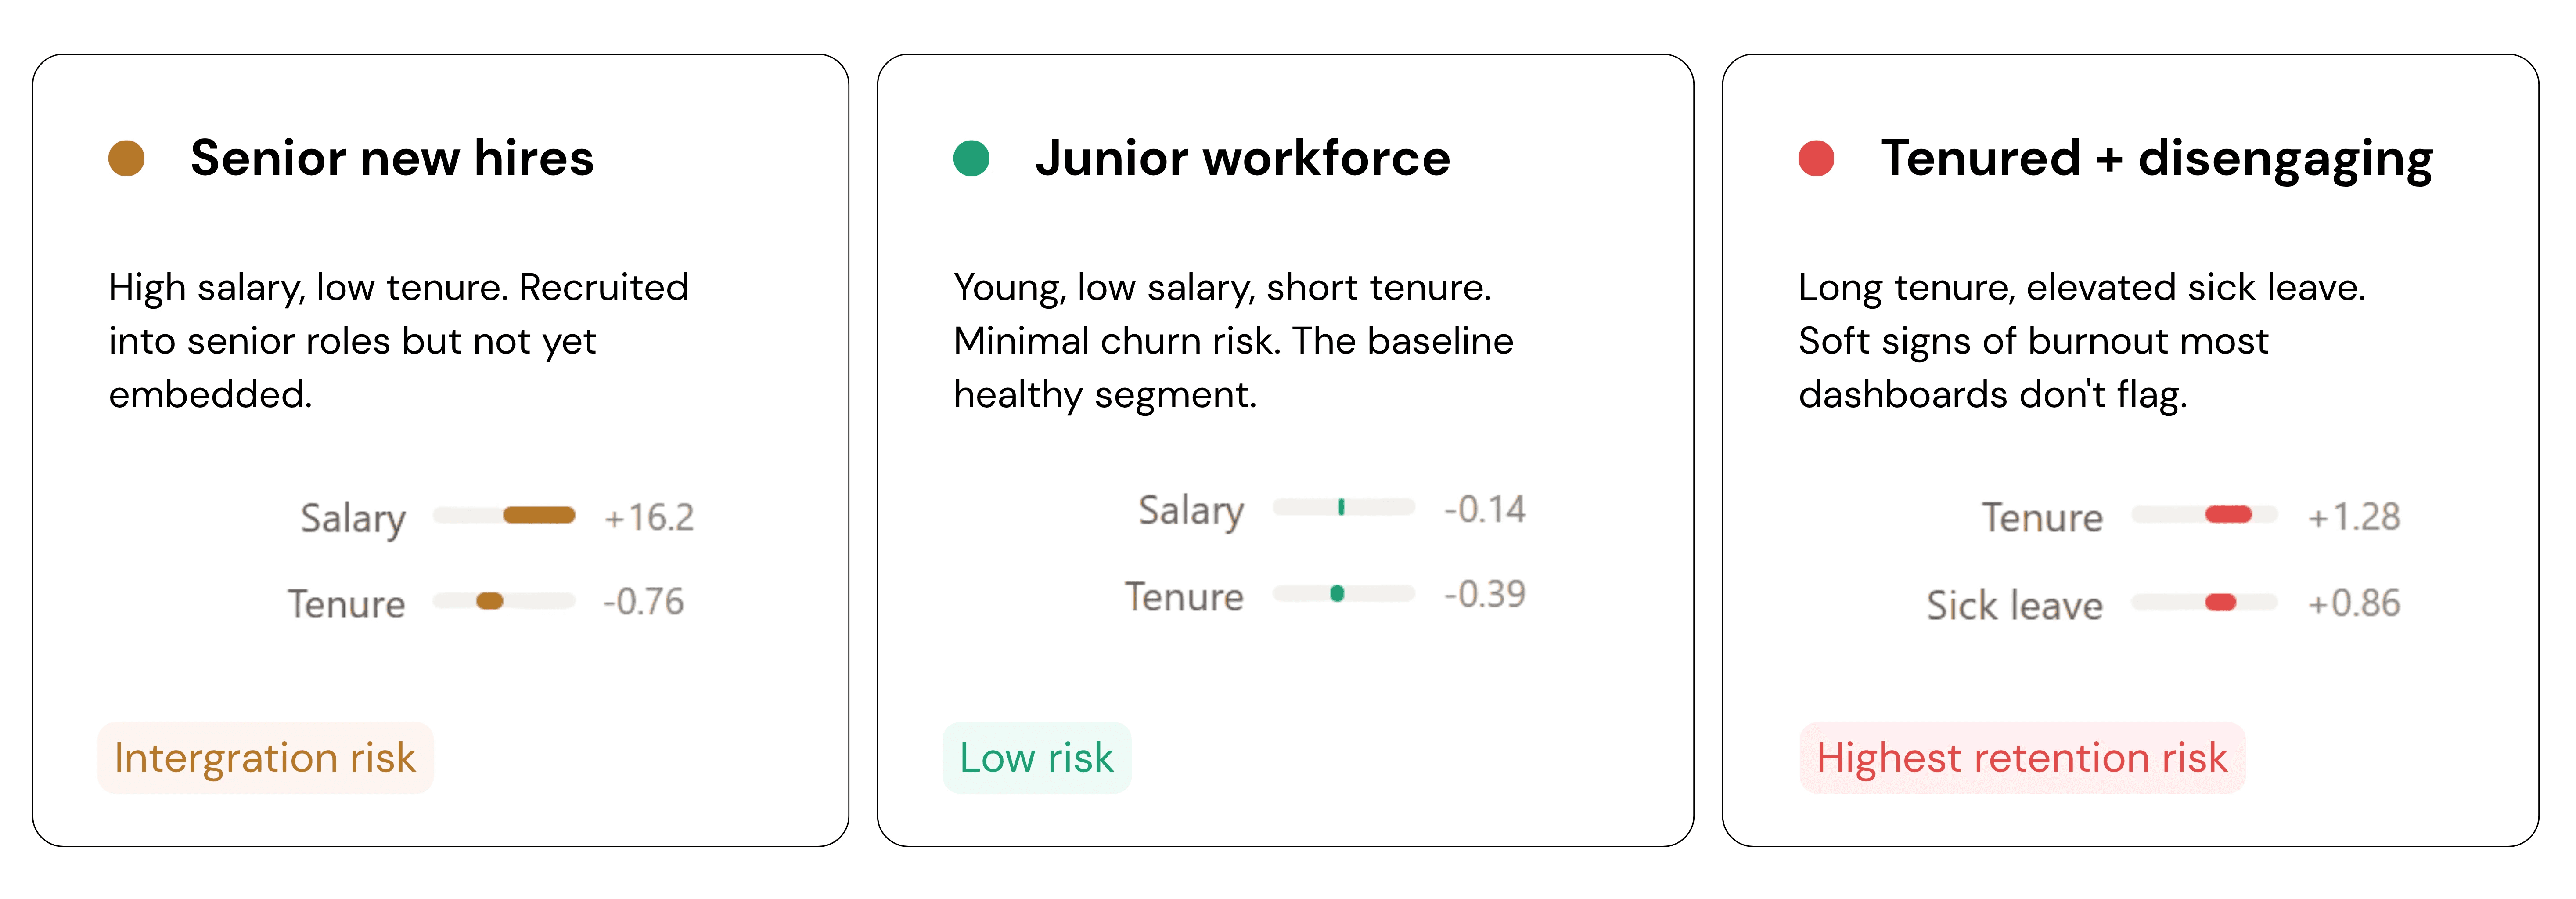
Before trying to predict who would leave, I needed to understand who was in the workforce. Clustering surfaced three distinct employee profiles the organisation had no existing language for, segments invisible to standard HR reporting.
/ When the Models Fail, the Strategy Starts
I trained three models to predict individual churn. All three failed, zero of 469 actual churners identified. The 83.9% accuracy headline looks normal initially, until you realise it's the base rate: a model that always guesses "stays" get the same score.
Model | Accuracy | Churners found | Key metric |
|---|---|---|---|
Logistic regression | 83.9% | 0 / 469 | R² = 0.039 |
CHAID decision tree | 83.9% | 0 / 469 | Risk = 0.161 |
Neural network | 84.7% | 0 / 469 | Test error = 15.3% |
The strategic call: A rebalancing technique (SMOTE) could have been applied to produce a model that looked better on paper. However, I chose not to, given the fact that it generates synthetic records of employees who don't exist, and in an HR context where interventions cost real money and affect real careers, optimising for a metric nobody should trust is worse than being honest about what the data can and can't support. Thus, the right move was to change the question.
The models couldn't predict who would leave. But they could tell us who we were systematically failing to keep.
Segment | Churn rate | vs. baseline |
|---|---|---|
Male employees | 11.3% | −4.8pp |
Org average | 16.1% | — |
Female (all) | 19.4% | +3.3pp |
Female, early tenure (≤1yr) | 28.0% | +11.9pp |
Female, mid-tenure (3–5yr) | 28.4% | +12.3pp |
What the regression coefficients revealed
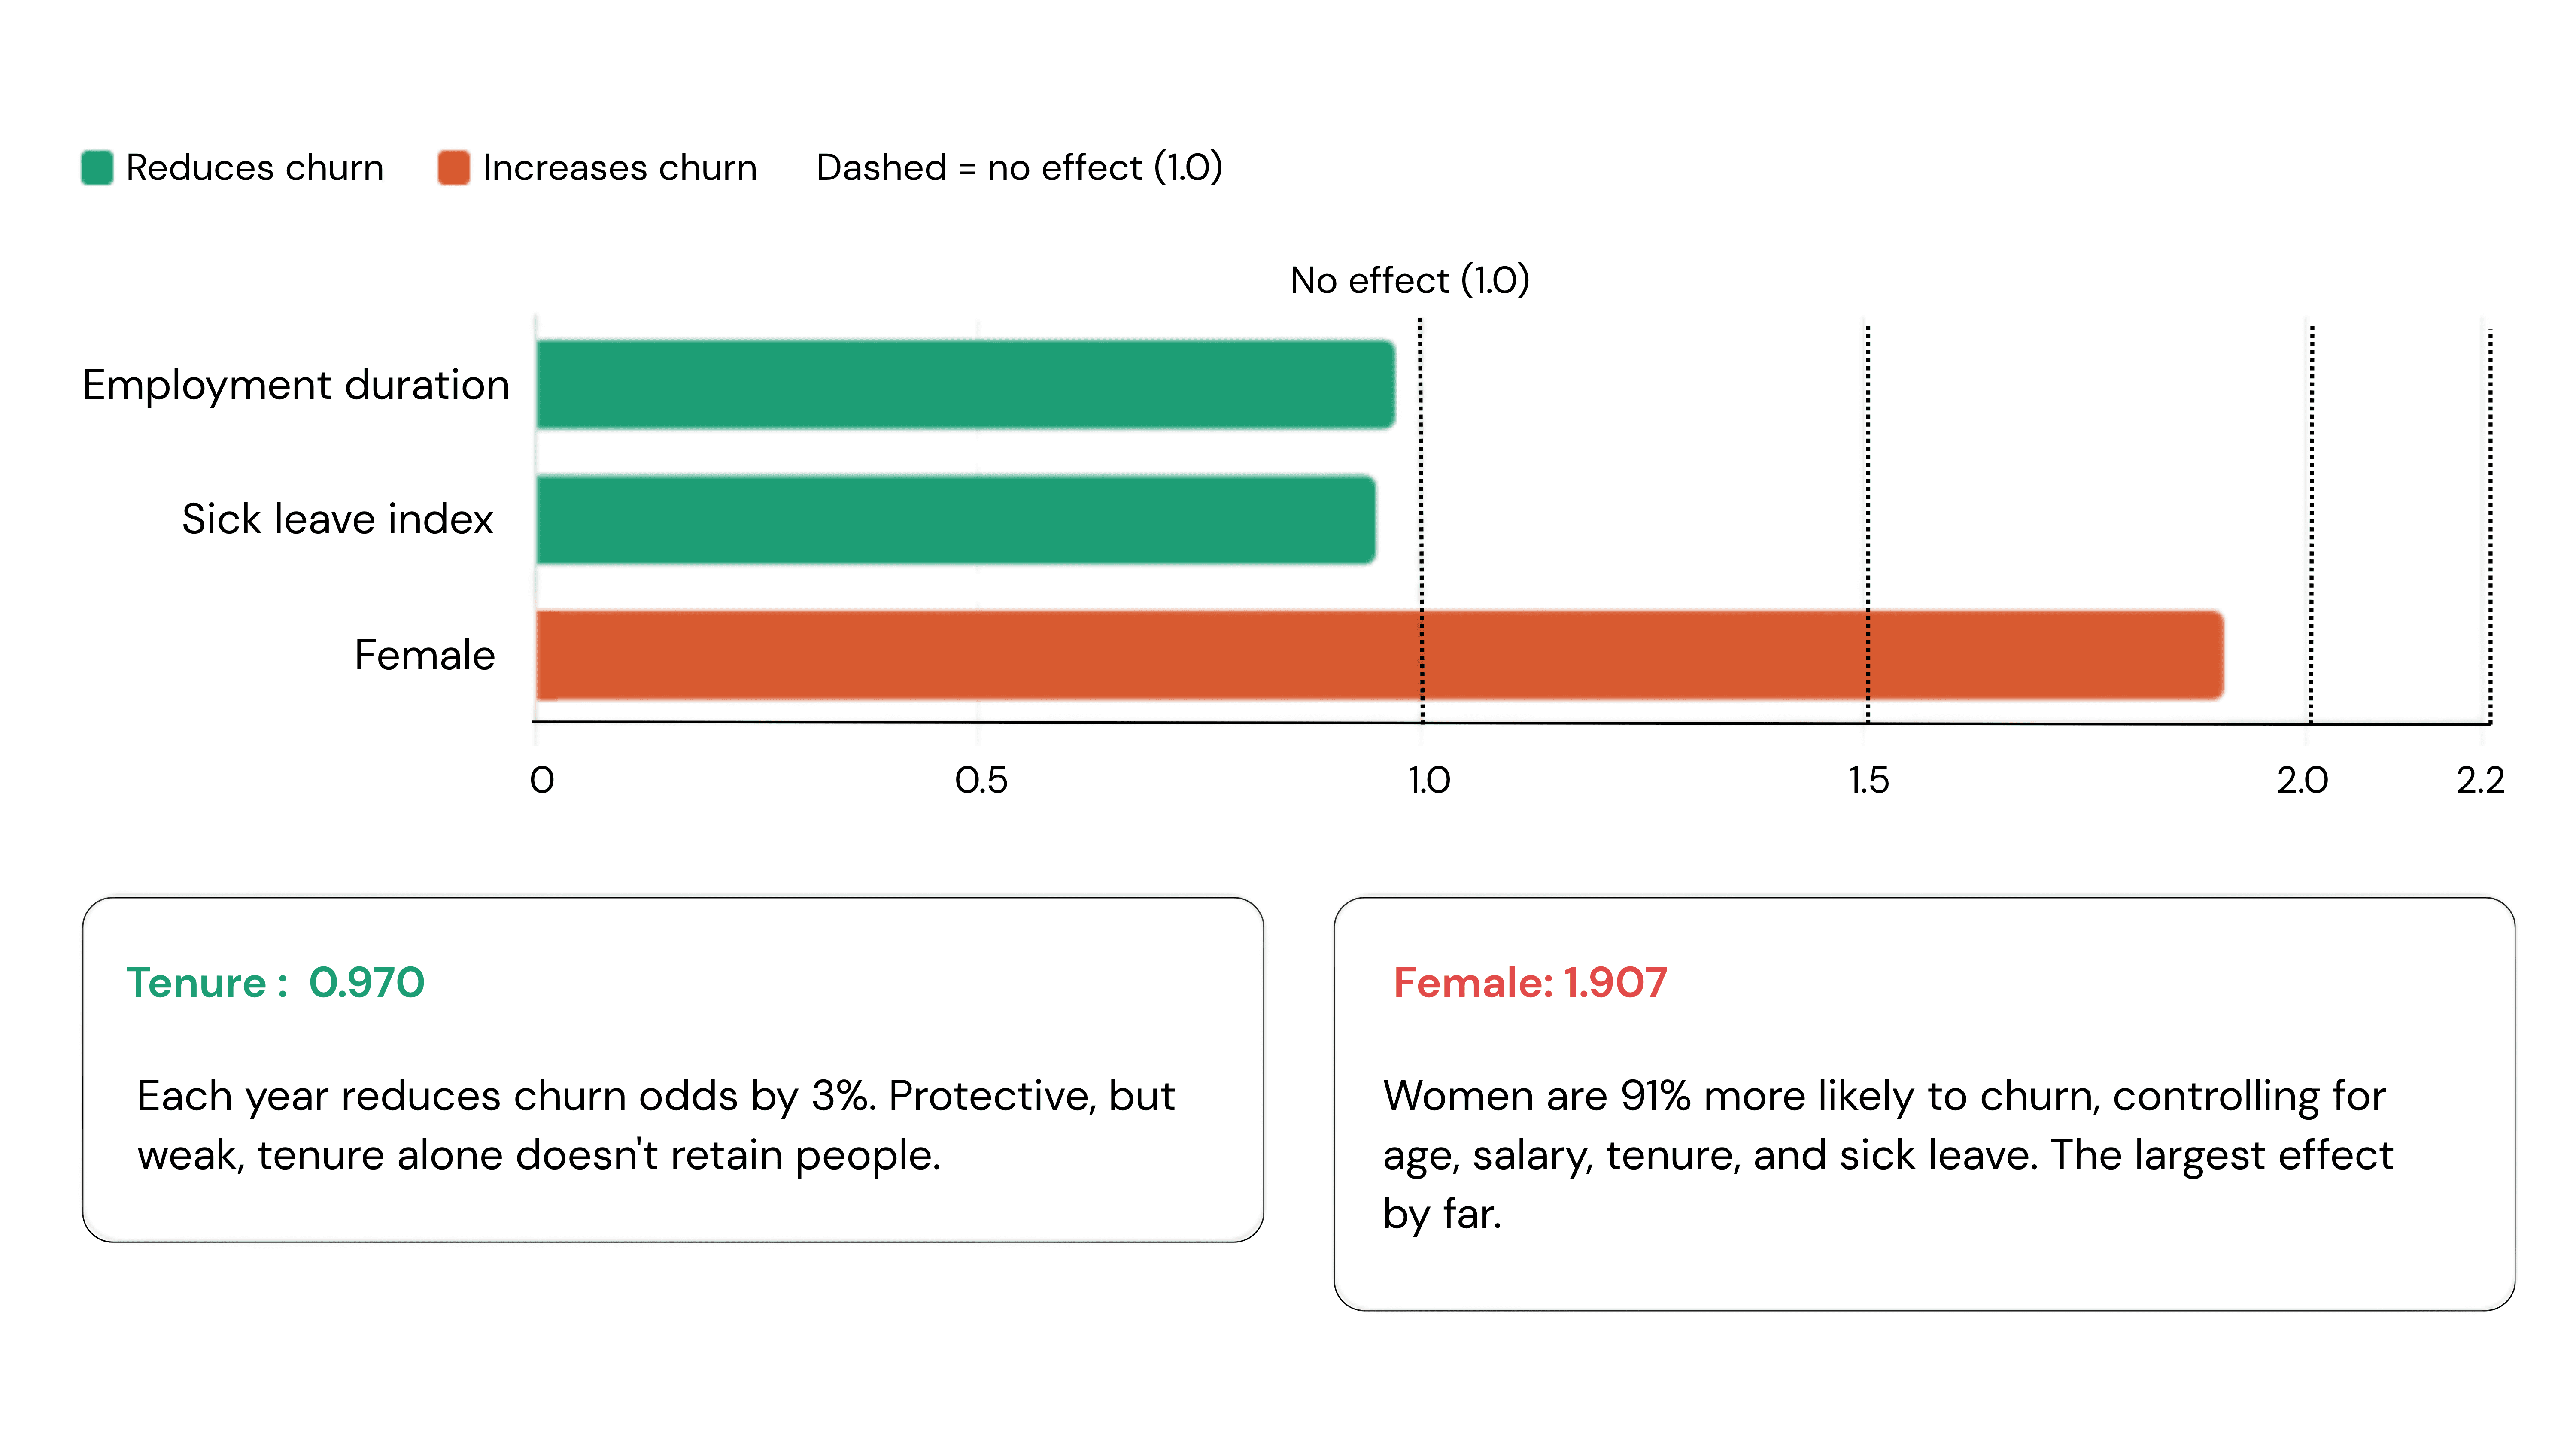
The model couldn't predict individual churn, but its coefficients survived, each one quantifying how much a single variable shifts churn likelihood when everything else is constant. Two reduced risk, and one nearly doubled.
Making the pattern visible: the decision tree
CHAID was chosen specifically because its output is a visual hierarchy that non-technical stakeholders can follow. The algorithm picked gender as the single strongest differentiator, the first split in the entire tree. Within women, employment duration created four risk sub-groups.

Validating the signal across model types
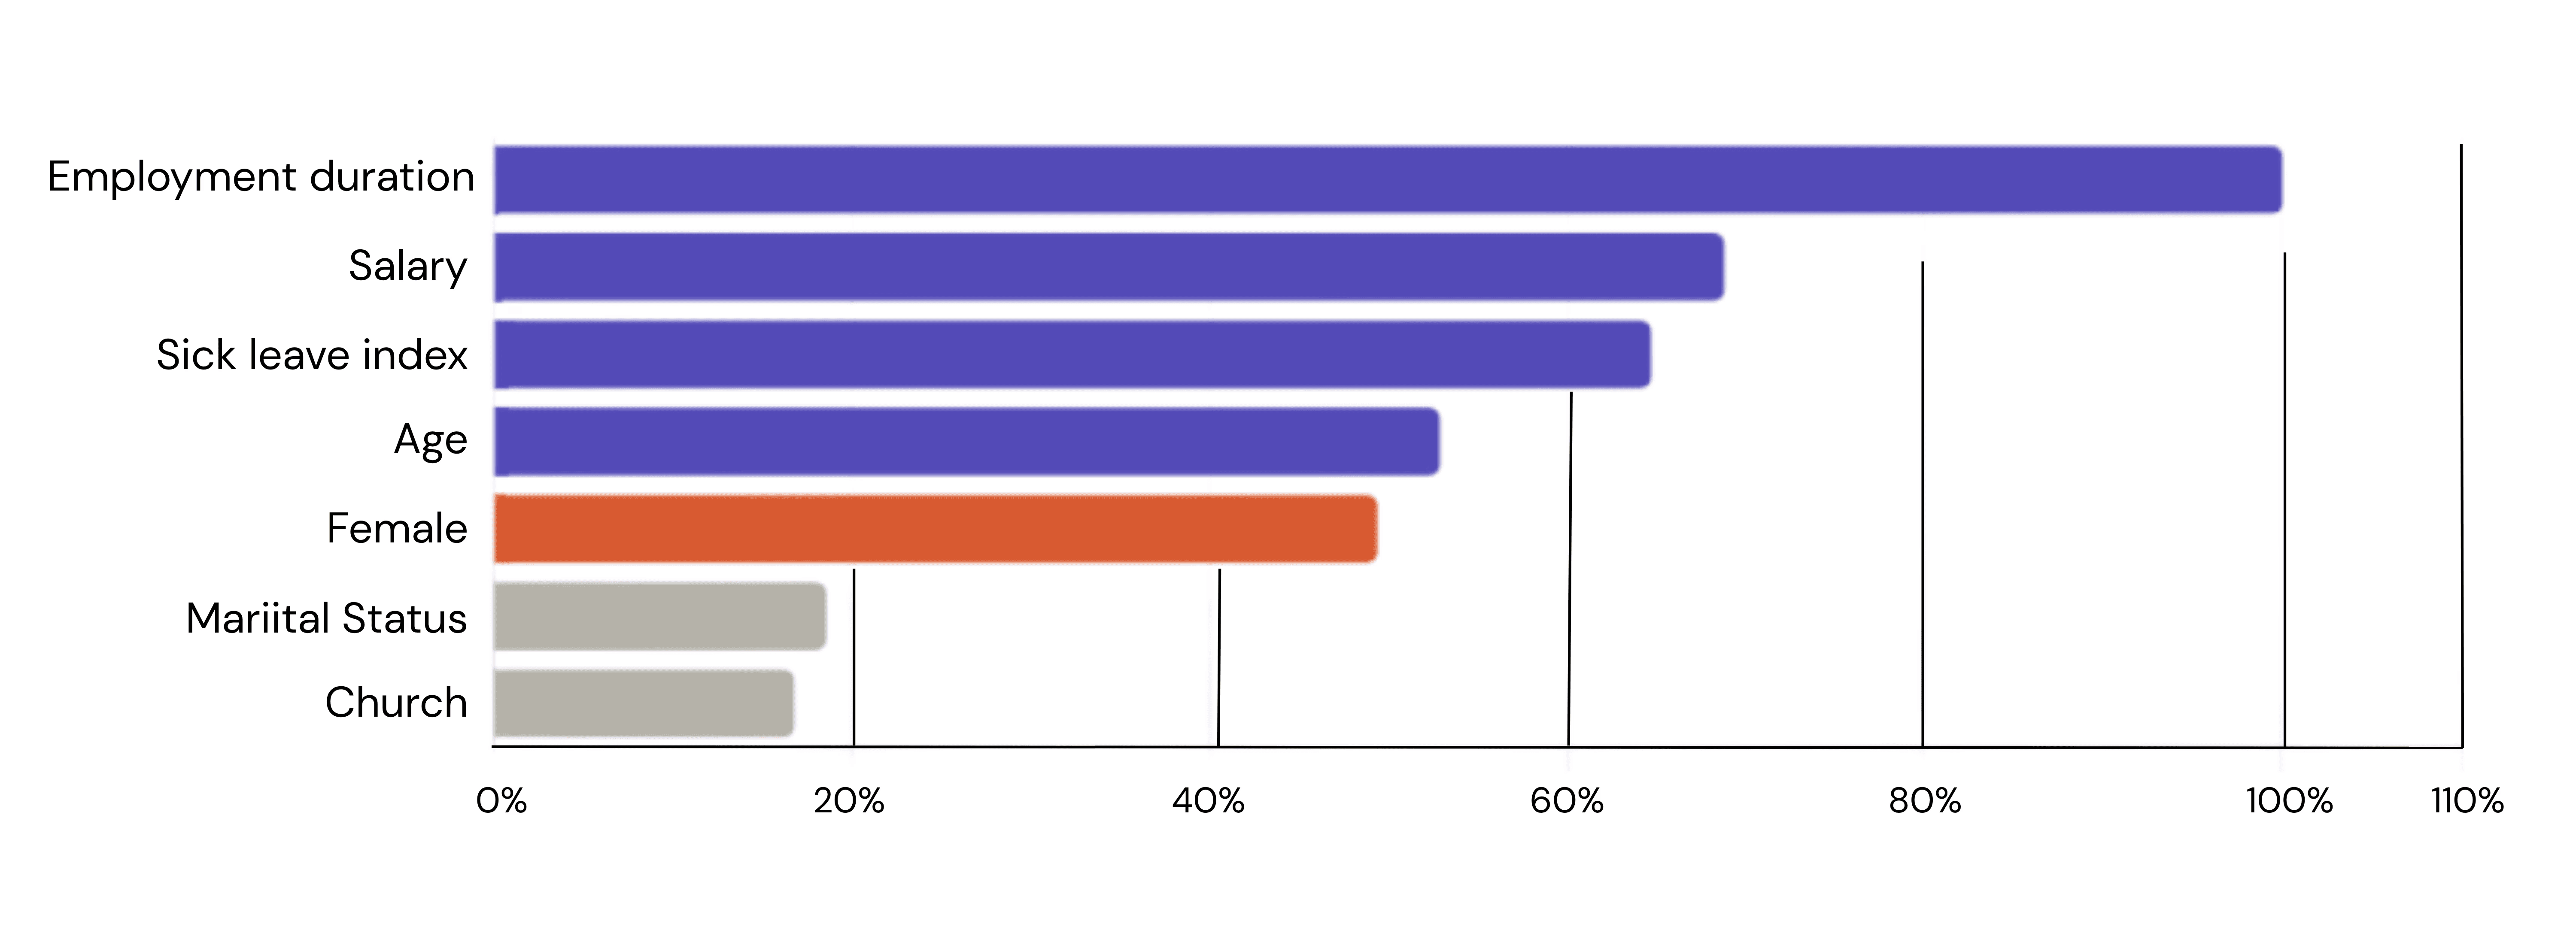
The neural network works completely differently from the other two models, with no interpretable coefficients and no visual tree. But it independently ranked the same variables as most important. When three fundamentally different architectures point at the same drivers, you can trust the finding.
/ The Core Finding: A Rentention Equity Gap
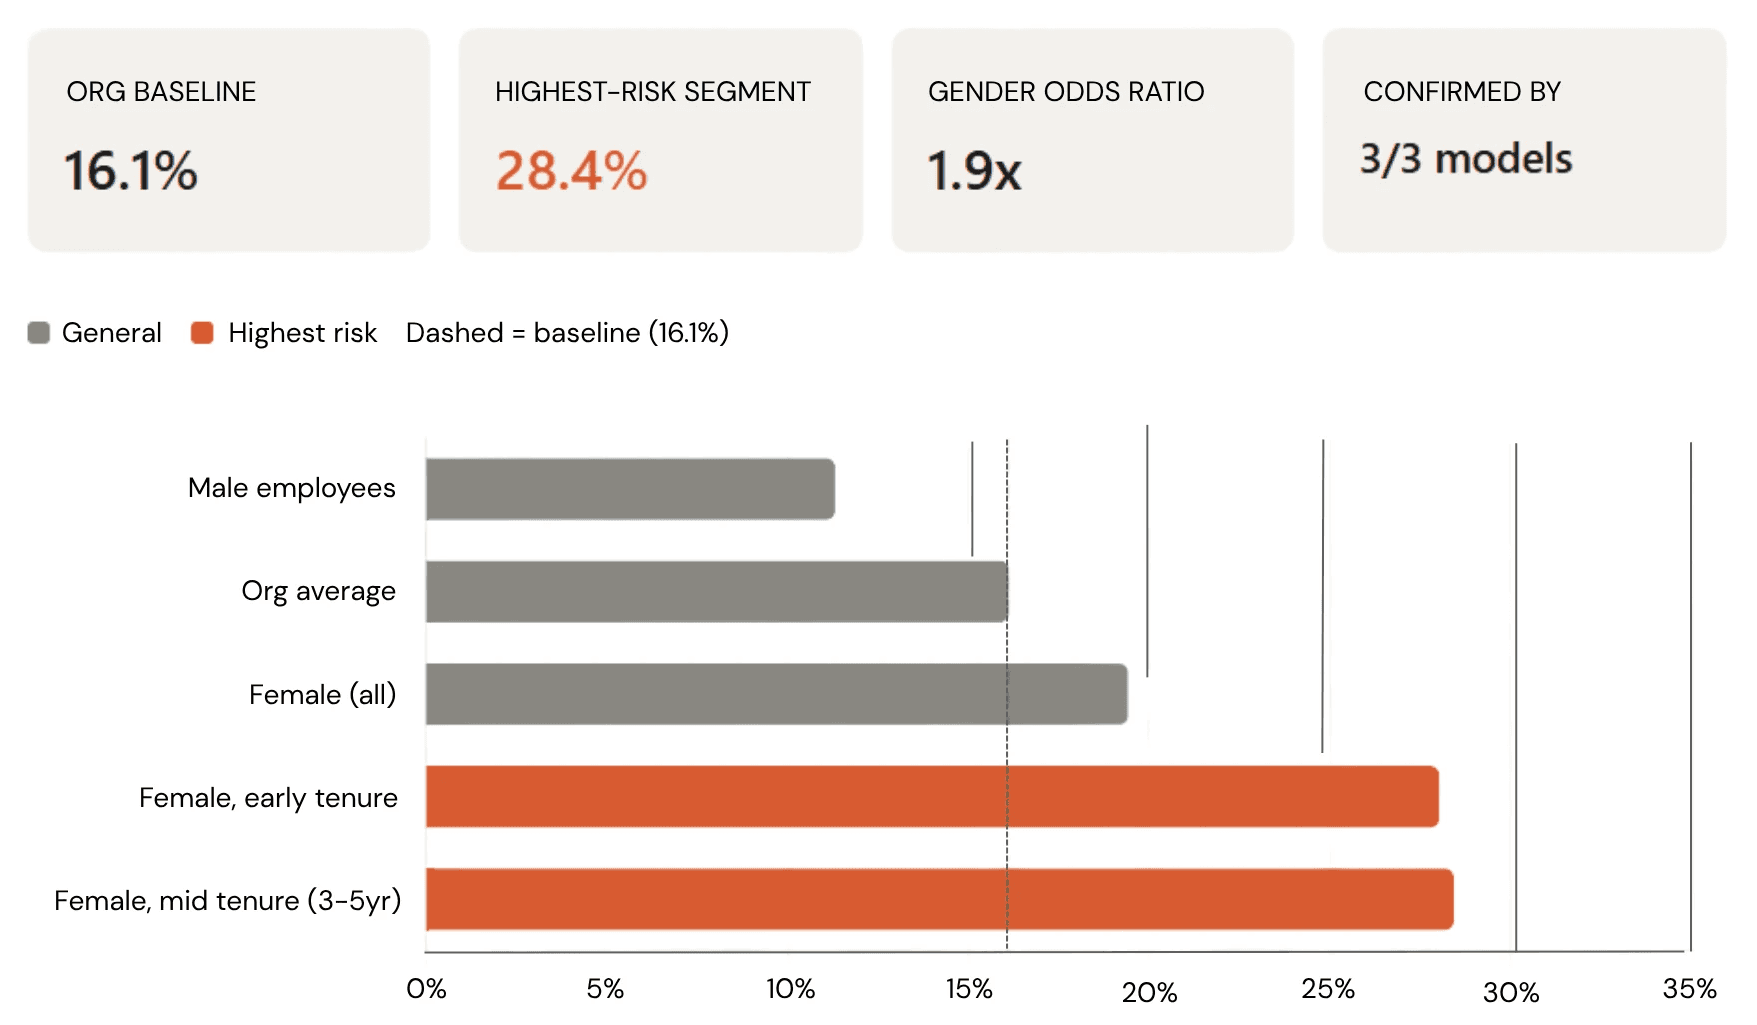
Rather than a prediction failure, this serves as a diagnosis. The firm is losing women at exactly the career stage where organisations convert early hires into long-tenured leaders. The gap persists after controlling for age, salary, and sick leave, which means it's structural and not compensatory.
/ Communicating to Stakeholders
The harder half was structuring findings for people who would never open SPSS. Each model earned its place not by accuracy, but by the audience it could reach.
Model | Best for | How it was used |
|---|---|---|
Logistic regression | Quantifying effect sizes | Odds ratios justified the gender equity audit |
CHAID tree | Executive storytelling | Visual hierarchy carried the segmentation story in the boardroom |
Neural network | Back-end validation | Confirmed variable importance independently |
Gender equity audit
Investigate the structural causes of elevated female churn through qualitative research, exit interviews, and career progression analysis. The data can name the pattern, but it can't explain the mechanism.
Wellbeing interventions for Cluster 3
Address burnout risk in long-tenured staff: mental health resources, flexible arrangements, and role rotation. The sick leave pattern is one of the early signals.
Structured onboarding for senior hires
Cluster 1 represents significant recruitment investment with integration risk. The cost of losing a senior hire is disproportionate to the cost of onboarding them properly.
/ Why This Matters
As AI becomes infrastructure for every product and service, the strategists shaping those products need to understand what's happening under the hood, not to build the models themselves, but to know when a model is answering the wrong question, when its accuracy is a mirage, and how to turn ambiguous output into a decision that can be acted on.
/ Problem
Structuring the problem
An AI product strategist needs to understand models by building them, not just in theory. Training three ML models on workforce data, and making a strategic call when the outputs didn't match the brief.
The brief was to predict employee churn. Before building anything, I needed to decide how to structure the problem, which tools would answer which questions, and who in the organisation needed to understand the output.
The sequence is to start with unsupervised clustering to surface segments the organisation couldn't see from its own dashboards, then layer on three predictive models, each chosen for a different audience. Logistic regression produces coefficients that justify policy to an HR team. CHAID produces a visual decision tree that carries a story in a boardroom. Finally, a neural network validates that findings hold when you relax the simpler models' assumptions.
/ The Patterns Hiding in Plain Sight
Before trying to predict who would leave, I needed to understand who was in the workforce. Clustering surfaced three distinct employee profiles the organisation had no existing language for, segments invisible to standard HR reporting.
/ When the Models Fail, the Strategy Starts
I trained three models to predict individual churn. All three failed, zero of 469 actual churners identified. The 83.9% accuracy headline looks normal initially, until you realise it's the base rate: a model that always guesses "stays" get the same score.
Model | Accuracy | Churners found | Key metric |
|---|---|---|---|
Logistic regression | 83.9% | 0 / 469 | R² = 0.039 |
CHAID decision tree | 83.9% | 0 / 469 | Risk = 0.161 |
Neural network | 84.7% | 0 / 469 | Test error = 15.3% |
The strategic call: A rebalancing technique (SMOTE) could have been applied to produce a model that looked better on paper. However, I chose not to, given the fact that it generates synthetic records of employees who don't exist, and in an HR context where interventions cost real money and affect real careers, optimising for a metric nobody should trust is worse than being honest about what the data can and can't support. Thus, the right move was to change the question.
The models couldn't predict who would leave. But they could tell us who we were systematically failing to keep.
Segment | Churn rate | vs. baseline |
|---|---|---|
Male employees | 11.3% | −4.8pp |
Org average | 16.1% | — |
Female (all) | 19.4% | +3.3pp |
Female, early tenure (≤1yr) | 28.0% | +11.9pp |
Female, mid-tenure (3–5yr) | 28.4% | +12.3pp |
What the regression coefficients revealed
The model couldn't predict individual churn, but its coefficients survived, each one quantifying how much a single variable shifts churn likelihood when everything else is constant. Two reduced risk, and one nearly doubled.
Making the pattern visible: the decision tree
CHAID was chosen specifically because its output is a visual hierarchy that non-technical stakeholders can follow. The algorithm picked gender as the single strongest differentiator, the first split in the entire tree. Within women, employment duration created four risk sub-groups.
Validating the signal across model types
The neural network works completely differently from the other two models, with no interpretable coefficients and no visual tree. But it independently ranked the same variables as most important. When three fundamentally different architectures point at the same drivers, you can trust the finding.
/ The Core Finding: A Rentention Equity Gap
Rather than a prediction failure, this serves as a diagnosis. The firm is losing women at exactly the career stage where organisations convert early hires into long-tenured leaders. The gap persists after controlling for age, salary, and sick leave, which means it's structural and not compensatory.
/ Communicating to Stakeholders
The harder half was structuring findings for people who would never open SPSS. Each model earned its place not by accuracy, but by the audience it could reach.
Model | Best for | How it was used |
|---|---|---|
Logistic regression | Quantifying effect sizes | Odds ratios justified the gender equity audit |
CHAID tree | Executive storytelling | Visual hierarchy carried the segmentation story in the boardroom |
Neural network | Back-end validation | Confirmed variable importance independently |
Gender equity audit
Investigate the structural causes of elevated female churn through qualitative research, exit interviews, and career progression analysis. The data can name the pattern, but it can't explain the mechanism.
Wellbeing interventions for Cluster 3
Address burnout risk in long-tenured staff: mental health resources, flexible arrangements, and role rotation. The sick leave pattern is one of the early signals.
Structured onboarding for senior hires
Cluster 1 represents significant recruitment investment with integration risk. The cost of losing a senior hire is disproportionate to the cost of onboarding them properly.
/ Why This Matters
As AI becomes infrastructure for every product and service, the strategists shaping those products need to understand what's happening under the hood, not to build the models themselves, but to know when a model is answering the wrong question, when its accuracy is a mirage, and how to turn ambiguous output into a decision that can be acted on.
/ Problem
Structuring the problem
An AI product strategist needs to understand models by building them, not just in theory. Training three ML models on workforce data, and making a strategic call when the outputs didn't match the brief.
The brief was to predict employee churn. Before building anything, I needed to decide how to structure the problem, which tools would answer which questions, and who in the organisation needed to understand the output.
The sequence is to start with unsupervised clustering to surface segments the organisation couldn't see from its own dashboards, then layer on three predictive models, each chosen for a different audience. Logistic regression produces coefficients that justify policy to an HR team. CHAID produces a visual decision tree that carries a story in a boardroom. Finally, a neural network validates that findings hold when you relax the simpler models' assumptions.
/ The Patterns Hiding in Plain Sight
Before trying to predict who would leave, I needed to understand who was in the workforce. Clustering surfaced three distinct employee profiles the organisation had no existing language for, segments invisible to standard HR reporting.
/ When the Models Fail, the Strategy Starts
I trained three models to predict individual churn. All three failed, zero of 469 actual churners identified. The 83.9% accuracy headline looks normal initially, until you realise it's the base rate: a model that always guesses "stays" get the same score.
Model | Accuracy | Churners found | Key metric |
|---|---|---|---|
Logistic regression | 83.9% | 0 / 469 | R² = 0.039 |
CHAID decision tree | 83.9% | 0 / 469 | Risk = 0.161 |
Neural network | 84.7% | 0 / 469 | Test error = 15.3% |
The strategic call: A rebalancing technique (SMOTE) could have been applied to produce a model that looked better on paper. However, I chose not to, given the fact that it generates synthetic records of employees who don't exist, and in an HR context where interventions cost real money and affect real careers, optimising for a metric nobody should trust is worse than being honest about what the data can and can't support. Thus, the right move was to change the question.
The models couldn't predict who would leave. But they could tell us who we were systematically failing to keep.
Segment | Churn rate | vs. baseline |
|---|---|---|
Male employees | 11.3% | −4.8pp |
Org average | 16.1% | — |
Female (all) | 19.4% | +3.3pp |
Female, early tenure (≤1yr) | 28.0% | +11.9pp |
Female, mid-tenure (3–5yr) | 28.4% | +12.3pp |
What the regression coefficients revealed
The model couldn't predict individual churn, but its coefficients survived, each one quantifying how much a single variable shifts churn likelihood when everything else is constant. Two reduced risk, and one nearly doubled.
Making the pattern visible: the decision tree
CHAID was chosen specifically because its output is a visual hierarchy that non-technical stakeholders can follow. The algorithm picked gender as the single strongest differentiator, the first split in the entire tree. Within women, employment duration created four risk sub-groups.
Validating the signal across model types
The neural network works completely differently from the other two models, with no interpretable coefficients and no visual tree. But it independently ranked the same variables as most important. When three fundamentally different architectures point at the same drivers, you can trust the finding.
/ The Core Finding: A Rentention Equity Gap
Rather than a prediction failure, this serves as a diagnosis. The firm is losing women at exactly the career stage where organisations convert early hires into long-tenured leaders. The gap persists after controlling for age, salary, and sick leave, which means it's structural and not compensatory.
/ Communicating to Stakeholders
The harder half was structuring findings for people who would never open SPSS. Each model earned its place not by accuracy, but by the audience it could reach.
Model | Best for | How it was used |
|---|---|---|
Logistic regression | Quantifying effect sizes | Odds ratios justified the gender equity audit |
CHAID tree | Executive storytelling | Visual hierarchy carried the segmentation story in the boardroom |
Neural network | Back-end validation | Confirmed variable importance independently |
Gender equity audit
Investigate the structural causes of elevated female churn through qualitative research, exit interviews, and career progression analysis. The data can name the pattern, but it can't explain the mechanism.
Wellbeing interventions for Cluster 3
Address burnout risk in long-tenured staff: mental health resources, flexible arrangements, and role rotation. The sick leave pattern is one of the early signals.
Structured onboarding for senior hires
Cluster 1 represents significant recruitment investment with integration risk. The cost of losing a senior hire is disproportionate to the cost of onboarding them properly.
/ Why This Matters
As AI becomes infrastructure for every product and service, the strategists shaping those products need to understand what's happening under the hood, not to build the models themselves, but to know when a model is answering the wrong question, when its accuracy is a mirage, and how to turn ambiguous output into a decision that can be acted on.